
Data Cuisine: Taking Data Visualisation To New Levels
2 July 2021
What does data taste like?
It’s probably not a question that’s crossed your mind, but data visualisation experts Susanne Jaschko and Moritz Stefaner decided to ask — and answer — the question as a way to make their field more personal, emotional and relevant.
Imagine a fish stew whose ingredients reflect the data about local fishing, a pizza topped to represent the population mix of Helsinki, or a selection of chocolates whose fillings represent the various causes of death for a population.
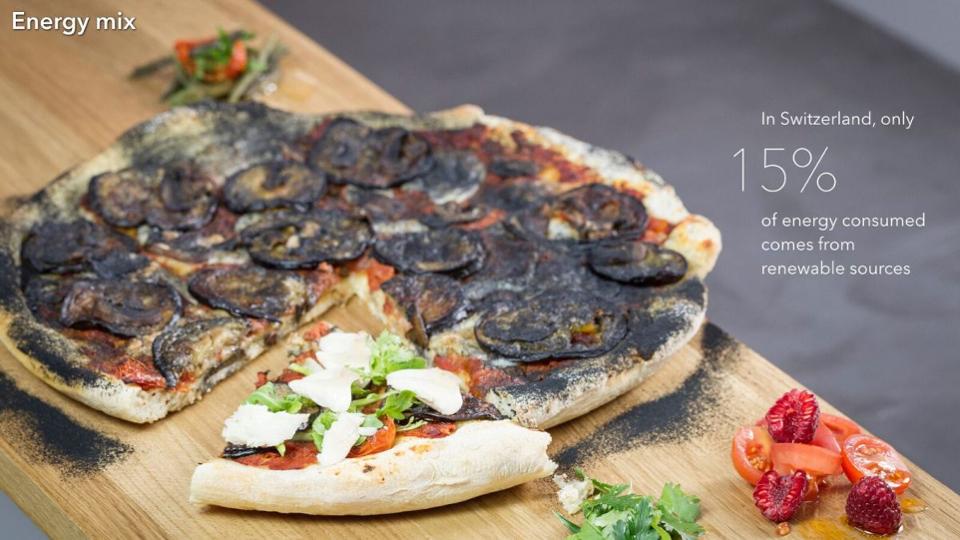
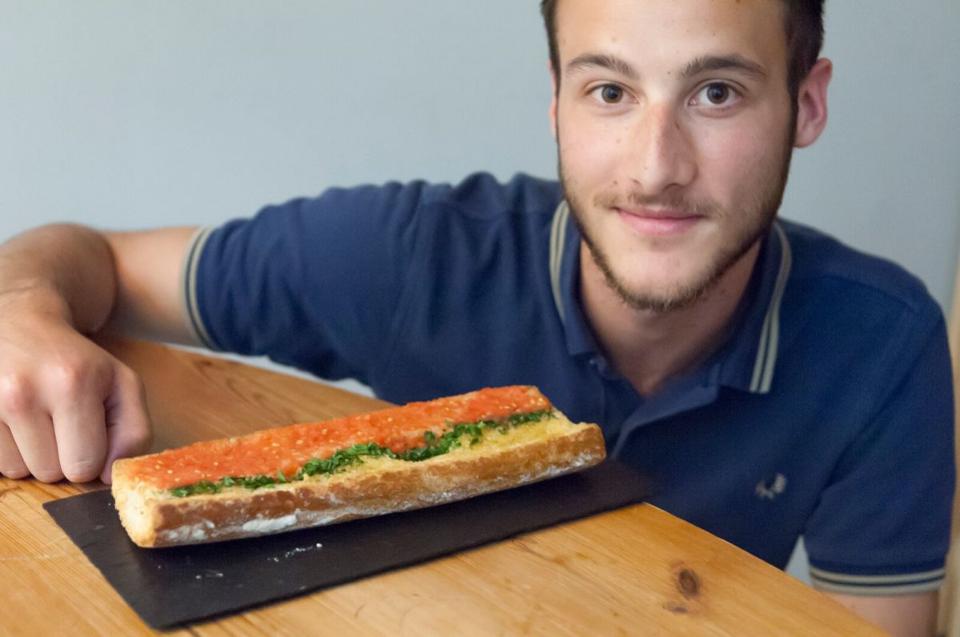
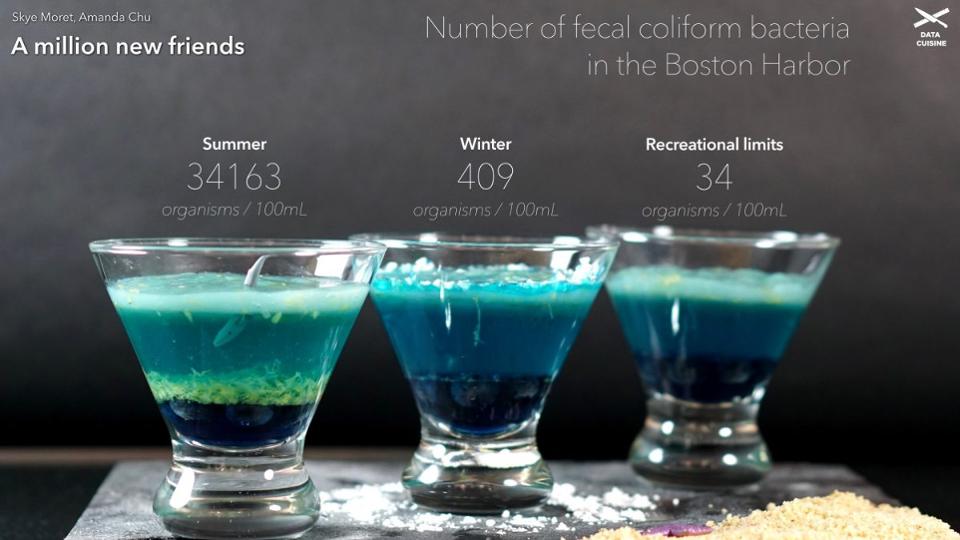
These are just some of the many beautiful and delicious data visualisations that have come out of the Data Cuisine workshops held by Jaschko and Stefaner. Participants are provided with access to local data and asked to choose data that has some personal meaning or relevance to them. They then use a state-of-the-art kitchen to create edible visualisations of that data, with help and tips from a professional chef.
The results are beautiful, delicious, and thought provoking.
Of course, food is a much less precise medium than a printed chart or graph for visuals, so where is the real benefit? Stefaner says that what the medium lacks in precision, it makes up for in depth. “Food is a much richer and more multi-faceted medium than visuals can ever be. In addition to anything you can do with graphics (i.e. express data through shapes, colors, forms…), with food, you can also go 3D, play with taste, texture, temperature, all the cultural connotations around a dish or ingredient.”
It is also a more challenging and intensive way to approach data visualisation, but it’s also more memorable. Imagine a curated ‘data dinner’ at which a group of politicians, managers, or scientists are served several courses, each representing some main point or issue in their field.
These dishes, while they require some interpretation and explanation, then become a physical representation and memorable experience of the data — rather than a simple chart on a slide.
“Data dishes are surprising,” Jaschko told me. “The ideal starting point for a discussion about the story and data ‘behind the dish’.”
Indeed, the theory here is that involving more of our senses in the digestion of data can help lay people understand and appreciate data more fully.
We know that the process of learning goes far beyond analytic understanding,” Jaschko says. “When we involve our senses in learning, we remember better. Data visualisation helps us to see the important aspects in data. The consumption of a data dish connects the analysis to a specific sensual experience. The ‘incorporation’ of the dish is part of the process.”
Moritz and Jaschko think of their project as “open source,” and hope that others around the world will see the concept and expand on it. Their workshops were imagined as a collaborative design research project, but they hope that the method and format could be taken and applied in other contexts, including corporate and business management as well as PR.
They hope to continue to spread the idea through their workshops, their website, and possibly a future book on the project.
Personally, I love the idea of incorporating data cuisine into important events for corporations. Imagine the impact a data-driven dish would make at the next annual sales meeting, board meeting, or even company picnic. It’s a fantastic way to ensure that a group of people who might otherwise not be entirely comfortable with data sets can absorb and digest the numbers (pun intended) easily.
Related Articles

Why Companies Are Paying Huge Money For AI Labelers
By now, “smart” versions exist of just about every home appliance, gadget and gizmos we can think of. However, manufacturers continue[...]

How AI Is Rewiring Filmmaking, And Why Craft Still Wins
By now, “smart” versions exist of just about every home appliance, gadget and gizmos we can think of. However, manufacturers continue[...]

Why Threat Intelligence Is Becoming A Must Have In Fraud Prevention
By now, “smart” versions exist of just about every home appliance, gadget and gizmos we can think of. However, manufacturers continue[...]
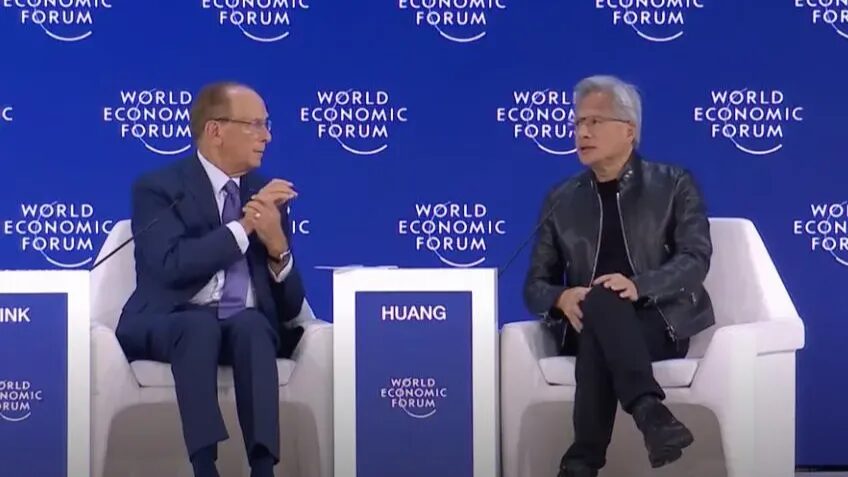
Davos 2026: Jensen Huang On The Five Layer AI Cake, The AI Bubble And Key AI Breakthroughs
By now, “smart” versions exist of just about every home appliance, gadget and gizmos we can think of. However, manufacturers continue[...]

Why Prompt Engineering Isn’t The Most Valuable AI Skill In 2026
By now, “smart” versions exist of just about every home appliance, gadget and gizmos we can think of. However, manufacturers continue[...]

Letting AI Browse The Web For You Sounds Great Until It Goes Wrong
By now, “smart” versions exist of just about every home appliance, gadget and gizmos we can think of. However, manufacturers continue[...]

Sign up to Stay in Touch!
Bernard Marr is a world-renowned futurist, influencer and thought leader in the fields of business and technology, with a passion for using technology for the good of humanity.
He is a best-selling author of over 20 books, writes a regular column for Forbes and advises and coaches many of the world’s best-known organisations.
He has a combined following of 4 million people across his social media channels and newsletters and was ranked by LinkedIn as one of the top 5 business influencers in the world.
Bernard’s latest book is ‘Generative AI in Practice’.
Social Media